I’ve been testing running shoes for over 5 years with more than 300 pairs under my belt (or feet) and I’m at the point where I can put on a pair of shoes for a few seconds, walk around in them for a few more seconds, and can usually tell if it will hurt me or not when running in them sockless. It will take about 3 or more miles of running before I can draw a definitive conclusion. It’s all about feel and all the standard characteristics found in minimalist running shoes: wide toe box, flexible, zero drop, low stack height, and lightweight. But I cannot quantify the results or have a scientific comparison between shoes. Until now.
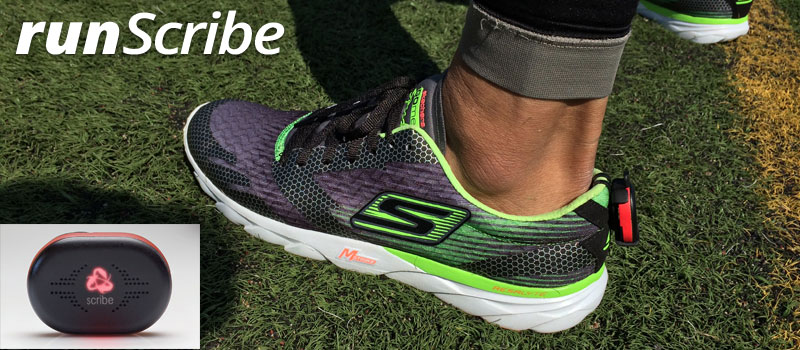
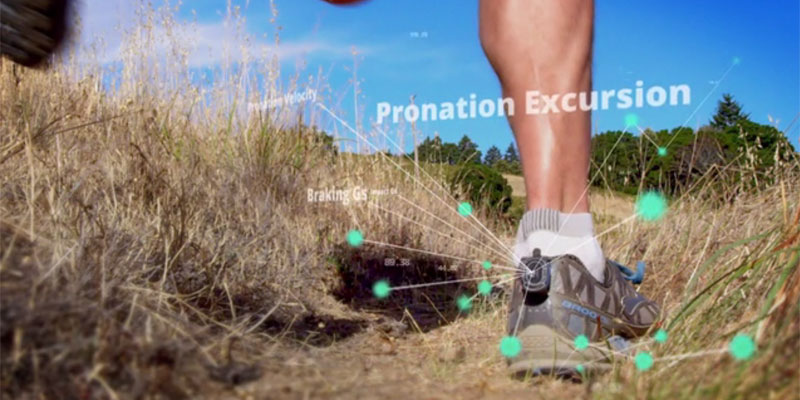
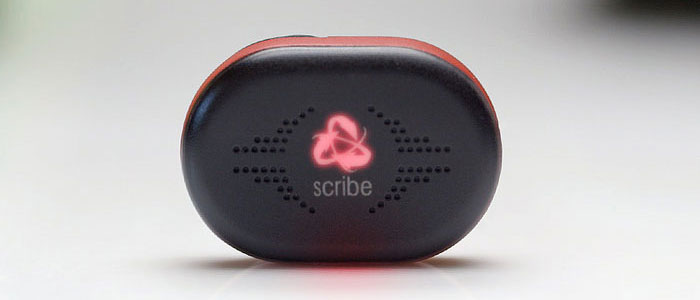
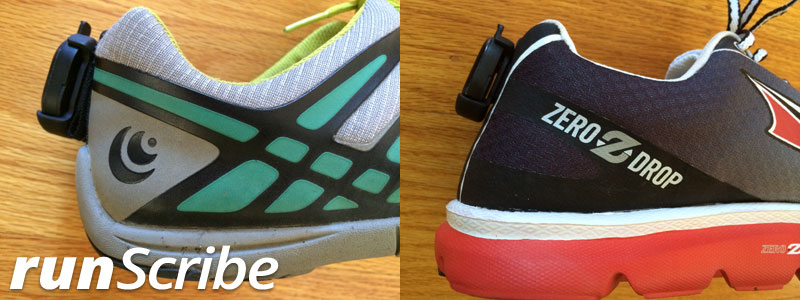
runScribe is a clip-on running wearable that mounts on the back of your shoe and uses a 9-axis sensor to precisely capture the movements of your foot during the gait cycle. The precision measurements, combined with runScribe’s kinematic engine delivers the most advanced set of running metrics available outside of a professional lab environment.
Most activity trackers and running watches track steps, distance and speed. But runScribe makes thousands of calculations for every stride and reports on 13 detailed kinematic metrics. The scale and detail of data available through runScribe has never been captured in a consumer device, giving athletes, trainers and coaches real-world data to make informed training decisions.
- Distance (DST, in km)
- Pace (SPD, in km/hr or min/mi)
- Stride Rate (SR, in strides/min)
- Stride Length (SL, in meters)
- Contact Time (CT, % of cycle time)
- Foot Strike Type (FSType, heel/mid/fore)
- Swing Excursion (SwingE, max pitch to min pitch)
- Stance Excursion (StanceE, pitch @ Foot Strike to Pitch @ Toe Off)
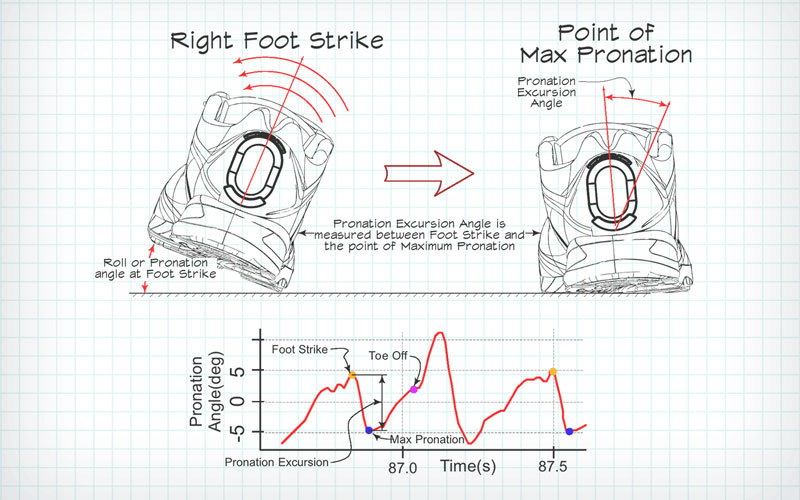
- Max Pronation Velocity (ProV, highest rate of pronation from Foot Strike to Max Pronation)
- Pronation Excursion 1 (ProMP, from Foot Strike to Max Pronation)
- Pronation Excursion 2 (ProTO, from Max Pronation to Toe Off)
- Impact Peak Gs
- Braking Peak Gs
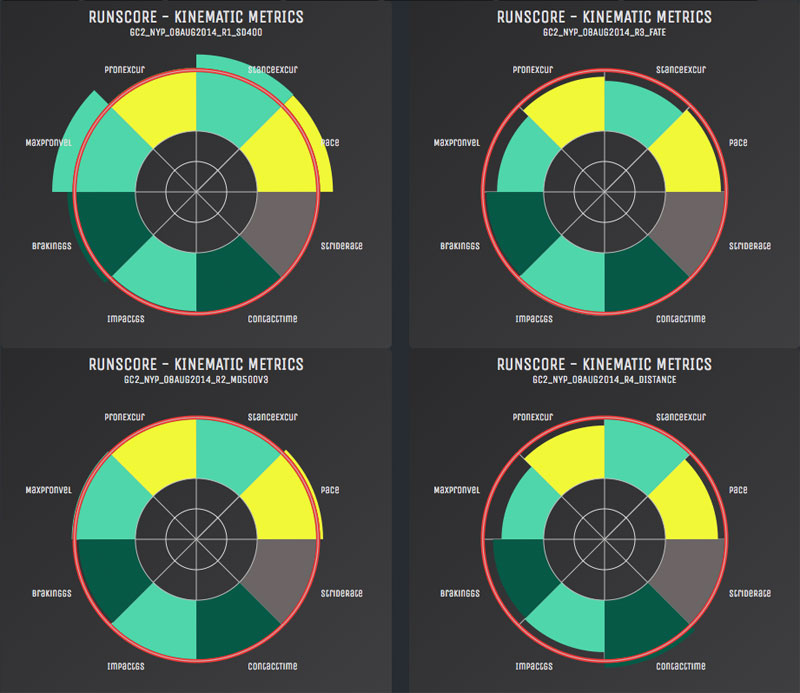
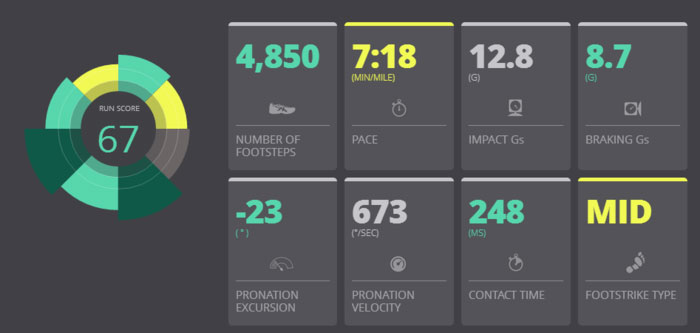
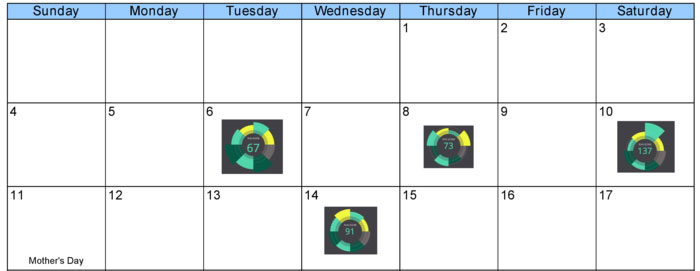
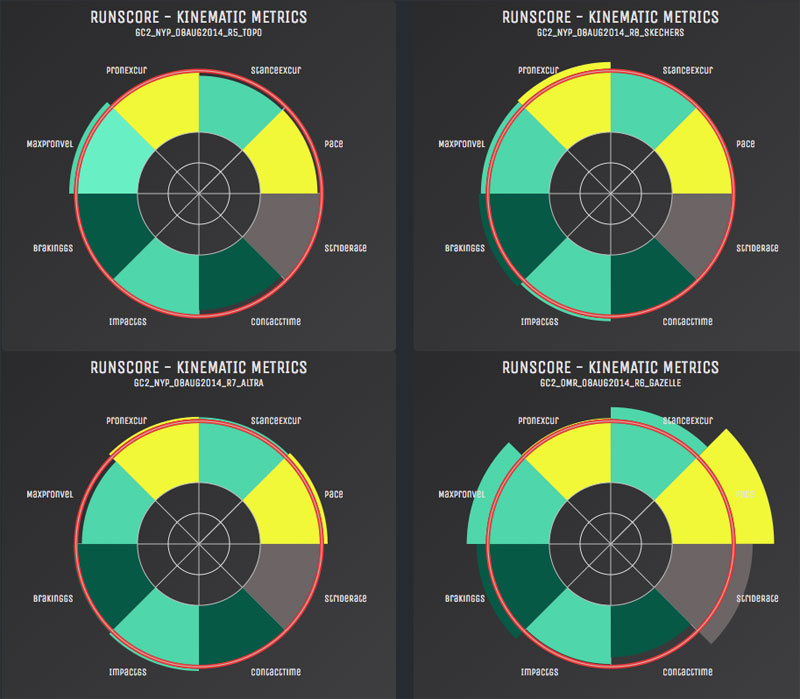
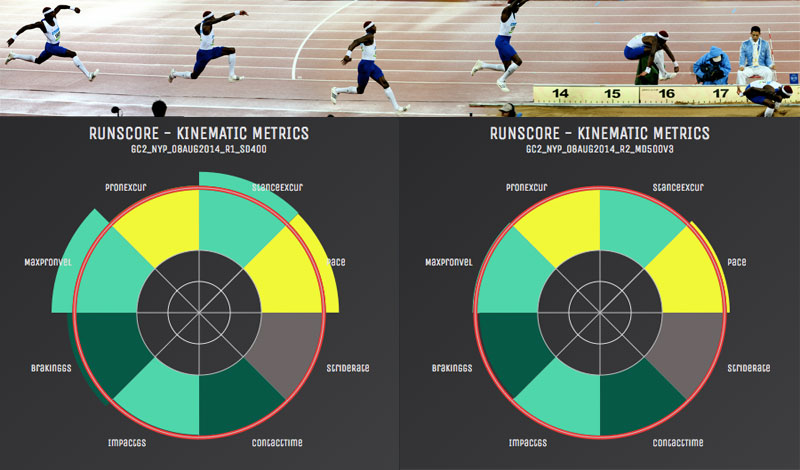
From the 13 kinematic metrics, your runScore is developed. runScore is a measurement of the intensity of your run, based on your runScribe history. It is unique to you, and the score gets smarter over time. The 13 kinematic metrics reported by runScribe are analyzed and compared with previous runs. It is one quick way to assess the overall run, compare it to previous runs, and you can easily drill down into the details to understand why your runScore changes in different environments. While runScore provides you with a snapshot, the data visualization tools will allow you to dig into the details of each of the 13 metrics.
Most of us prefer visuals over graphs and tables. runScribe is offering three versions (Starter, Pro, Science) depending on how much detail you want access to and what you want to visualize. If you just want a quick look at your runScore to get an idea of the intensity of your run, go with the runScribe Starter unit (you can upgrade to Pro at any time). With runScribe Pro, you can see your runScore and access to all 13 kinematic metrics – explore in details where and why there are differences. With runScribe Science, you can access the raw data (accelerometer, gyro, and quaternion) to see every detail that runScribe captures.
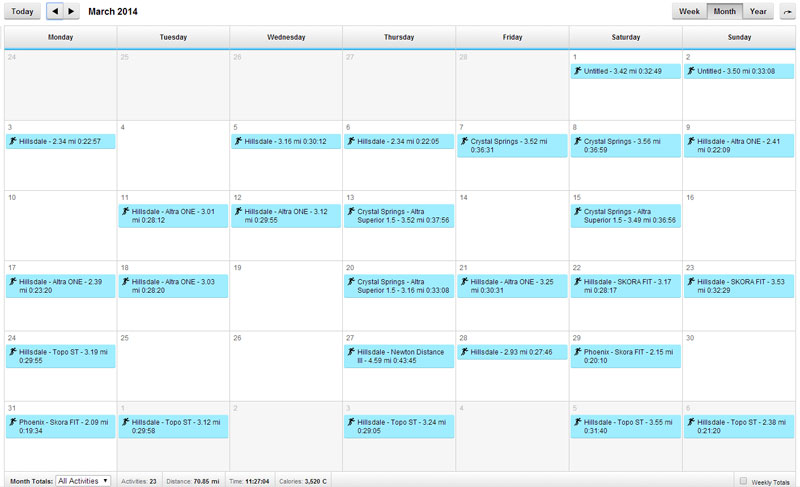
Looking at a calendar view from my Garmin Connect, I can see how many days I run and how far. But it does not tell me how hard I exercised if my body does not tell me during the week. I might have to ease off or turn up the pace depending on my previous workouts.
But runScribe calendar view with a runScore thumbnail for each day tells me instantly!
runScribe data can be used to help all types of runners and athletes understand and improve their performance. My personal interests are threefold:
- Quantify all my wear testing on a shoe by shoe basis when running in them on different terrains.
- Analyze my track and field sprints (100m, 200m and 400m) and jumps (long, triple, and high jumps) to see where I can improve.
- Last but probably the most important of all, how can I prevent and avoid injury when running in different shoes and my foot (and body) movements in various track & field events.
runScribe has just launched a Kickstarter campaign and I would pray that they get funded quickly so I can learn and see all the data mining done with crowd sourced data – from runners (customers) once they have runScribe attached to their shoes later this year. We can learn so much about the impact of running shoes and running form and how to prevent running injuries. All done with thousands (or millions) of runners (various levels, gender, and built) in the real world instead of on a treadmill in a lab with limited subjects.
I will be testing more shoes in the next few months once I master the advanced features of runScribe and quantify the raw data using their cloud tool and mobile apps. For example, which track spikes (NB SD400 or NB MD500v3) would fare better for me in long and triple jumps? Break it down into my initial 16 steps run up plus the last two steps (Contact Time, Impact Gs, and Braking Gs). Correlate that with the jump distances. Does it make sense? What makes a great jump versus a mediocre jump? How about for the 400m sprint? So many questions, so little time…
In shoe testing and reviewing, be your own personal shoe reviewer. What works for me may or may not work for you – mileage varies based on your running form, built, terrains, and distance. Does a 4mm heel-to-toe differential or drop affect my running form? Does extra cushioning increase how hard I hit the ground because of dampened proprioception? Get these questions answered instantly just for you with runScribe!
But most important of all, what is the impact on my running form with different shoe technology and how can I improve my form and performance. And what is the intensity of my workout? This and more can only be determined with runScribe.
Know the intensity of each run. Get a 3D view of your run. Run smarter, longer, and injury-free. runScribe.



1 thought on “Be a Shoe Reviewer and Personal Coach with runScribe”
Comments are closed.